The article mainly refers Exercise 2 - Track User Mode Process Allocations | Microsoft Docs.
1. Install Windows Performance Recorder and Analyzer
Download and install ADK from here. The windows build version can be checked by running “winver” via Win+r.
It’s sufficient to only install the component “Windows Performance Toolkit”
2. Enable Tracing the Target Process
For example, to enable tracking ckb
reg add "HKLM\Software\Microsoft\Windows NT\CurrentVersion\Image File Execution Options\ckb.exe" /v TracingFlags /t REG_DWORD /d 1 /f
Pay attention to the executable name “ckb.exe” used in the command. The command requires administrator permission. A simple way is starting an admin PowerShell using keyboard shortcuts Win+x a.
3. Build the Process With Debug Symbols
In Rust, this can be enabled by adding debug = true to Cargo.toml
[profile.release]
debug = true
Now cargo build --release will also creates a pdb file, which contains the debug symbols.
4. Start Recording
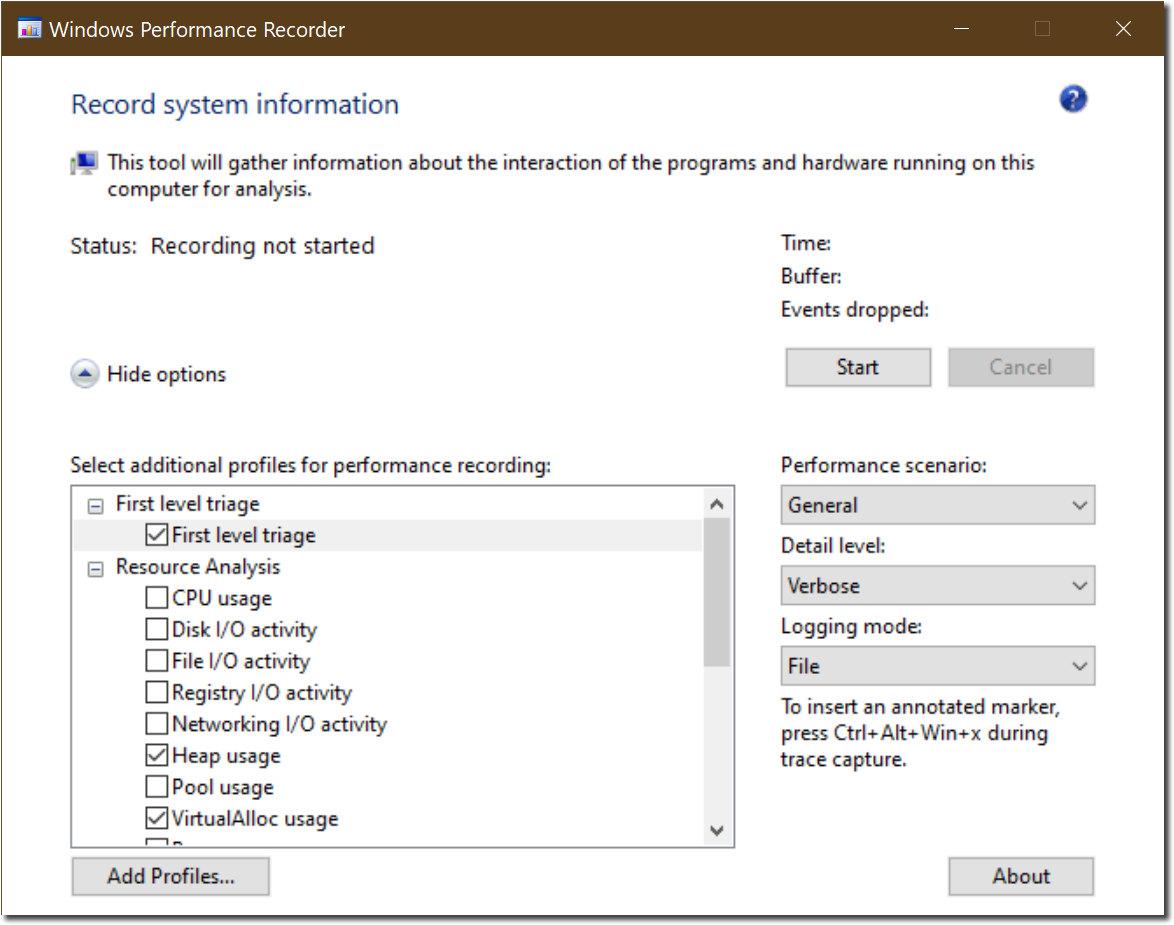
Start Windows Performance Recorder from Start Menu. Check “Heap usage” and “VirtualAlloc usage” in the resource analysis. Then click the “Start” button.
5. Launch Process
Launch the process for a while, like 3 minutes. On my 16G memory machine, Windows Performance Analyzer seems cannot load too long recording. It will complain there is no enough memory.
6. Stop Recording and Save the Report
Reactivate Windows Performance Recorder and click the “Save” button.
7. Open the Report in Windows Performance Analyzer
Open the saved report file in Windows Performance Analyzer.
Expand the Memory in the left side bar and drag “VirtualAlloc Commit LifeTimes” chart to the Analysis tab.
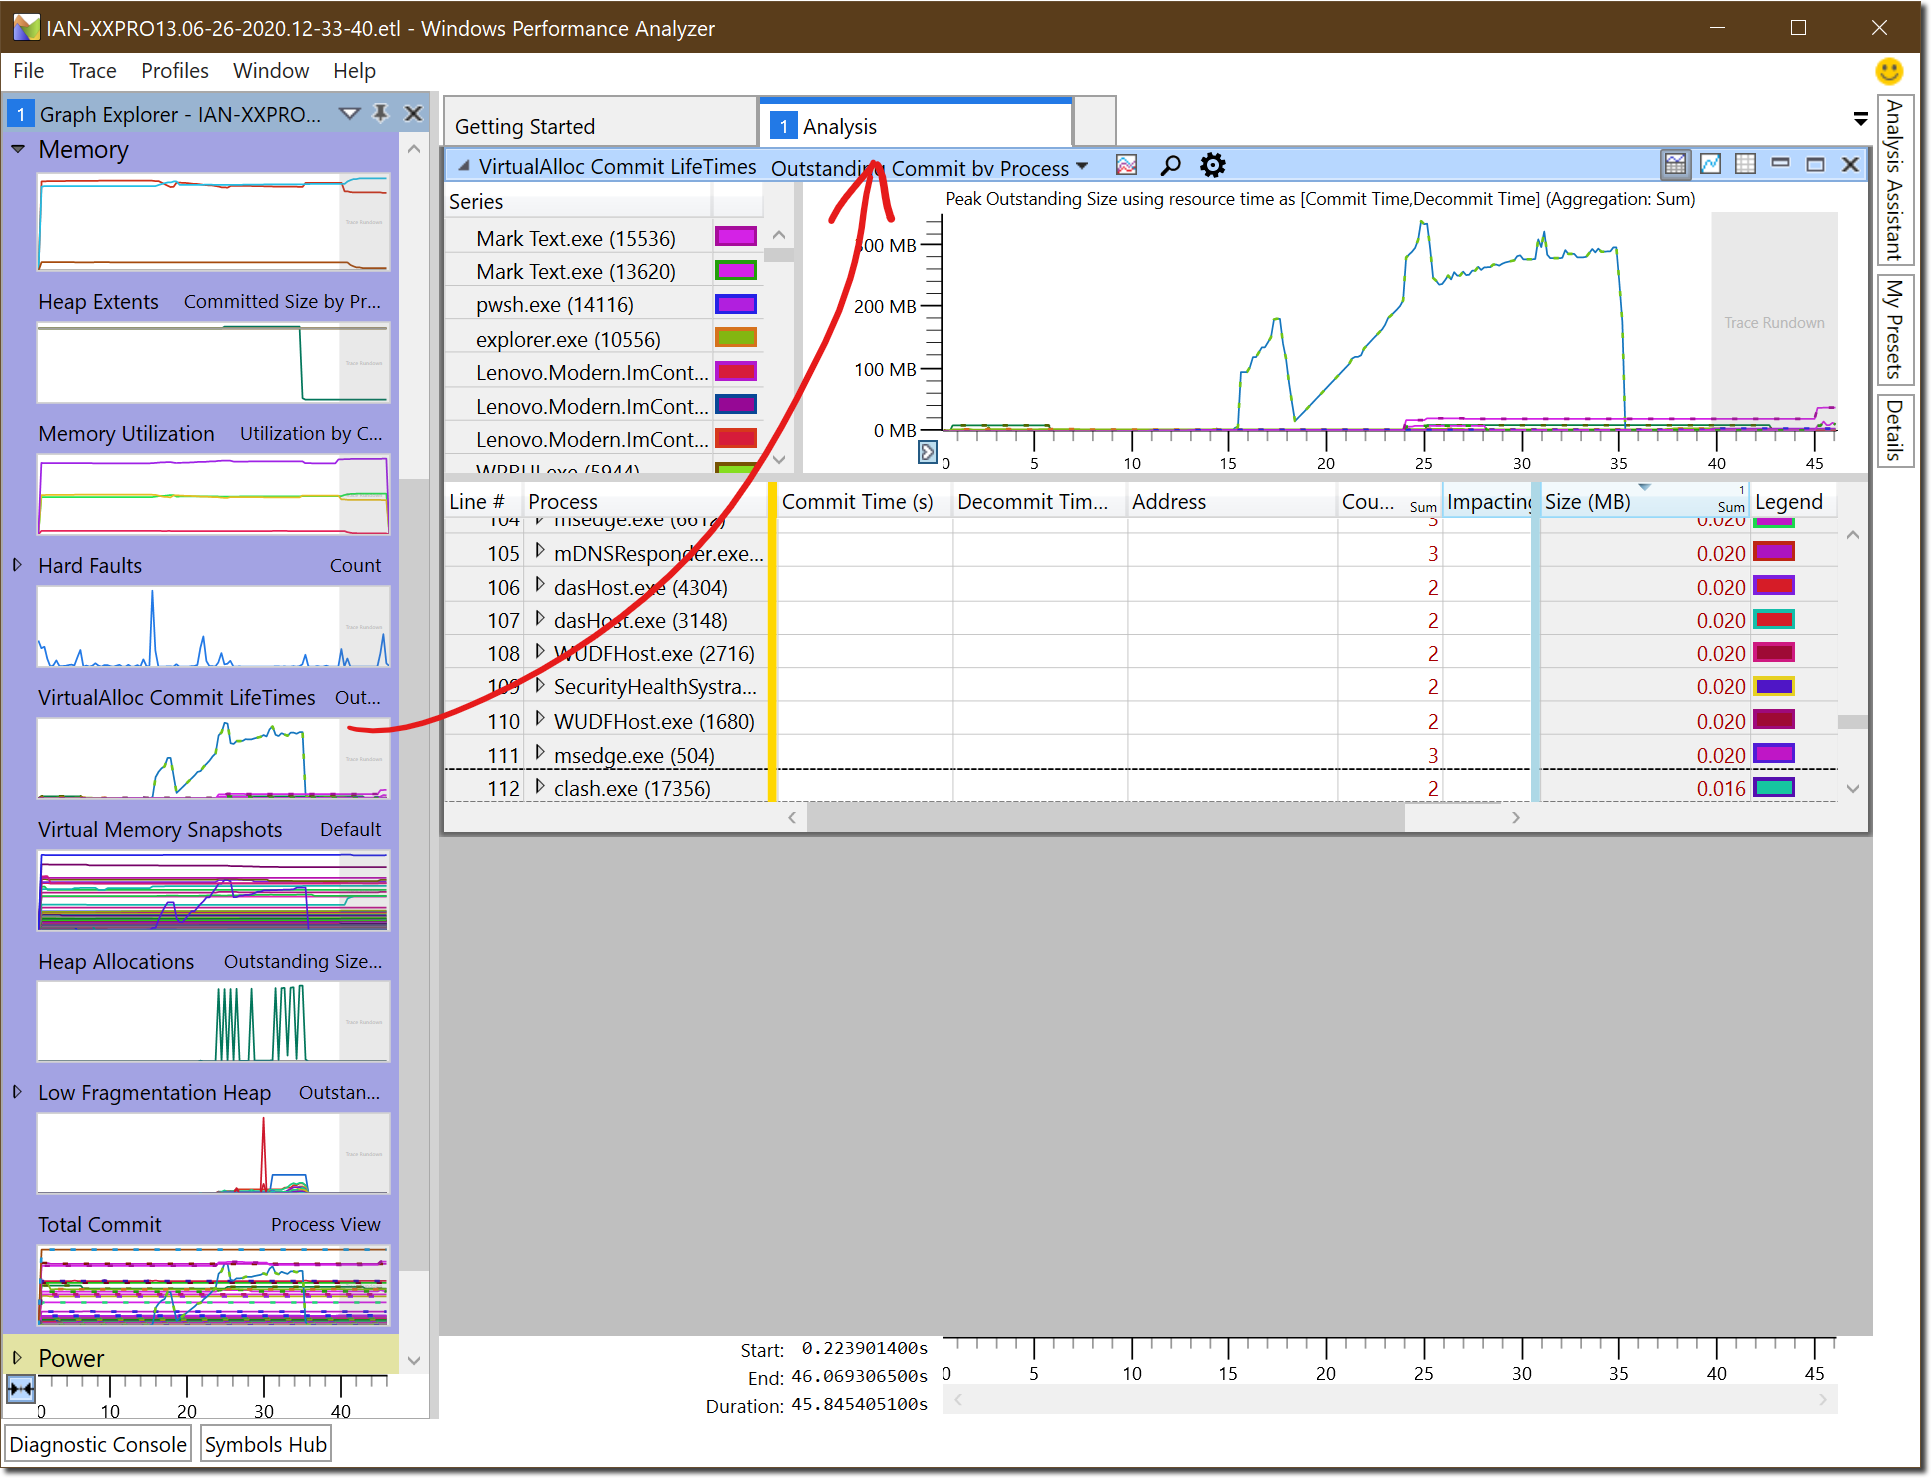
VirtualAlloc Commit LifeTimes tracking records all the heap memory allocation, when they are allocated and freed. It can help us to find out who has allocated memories but not return them.
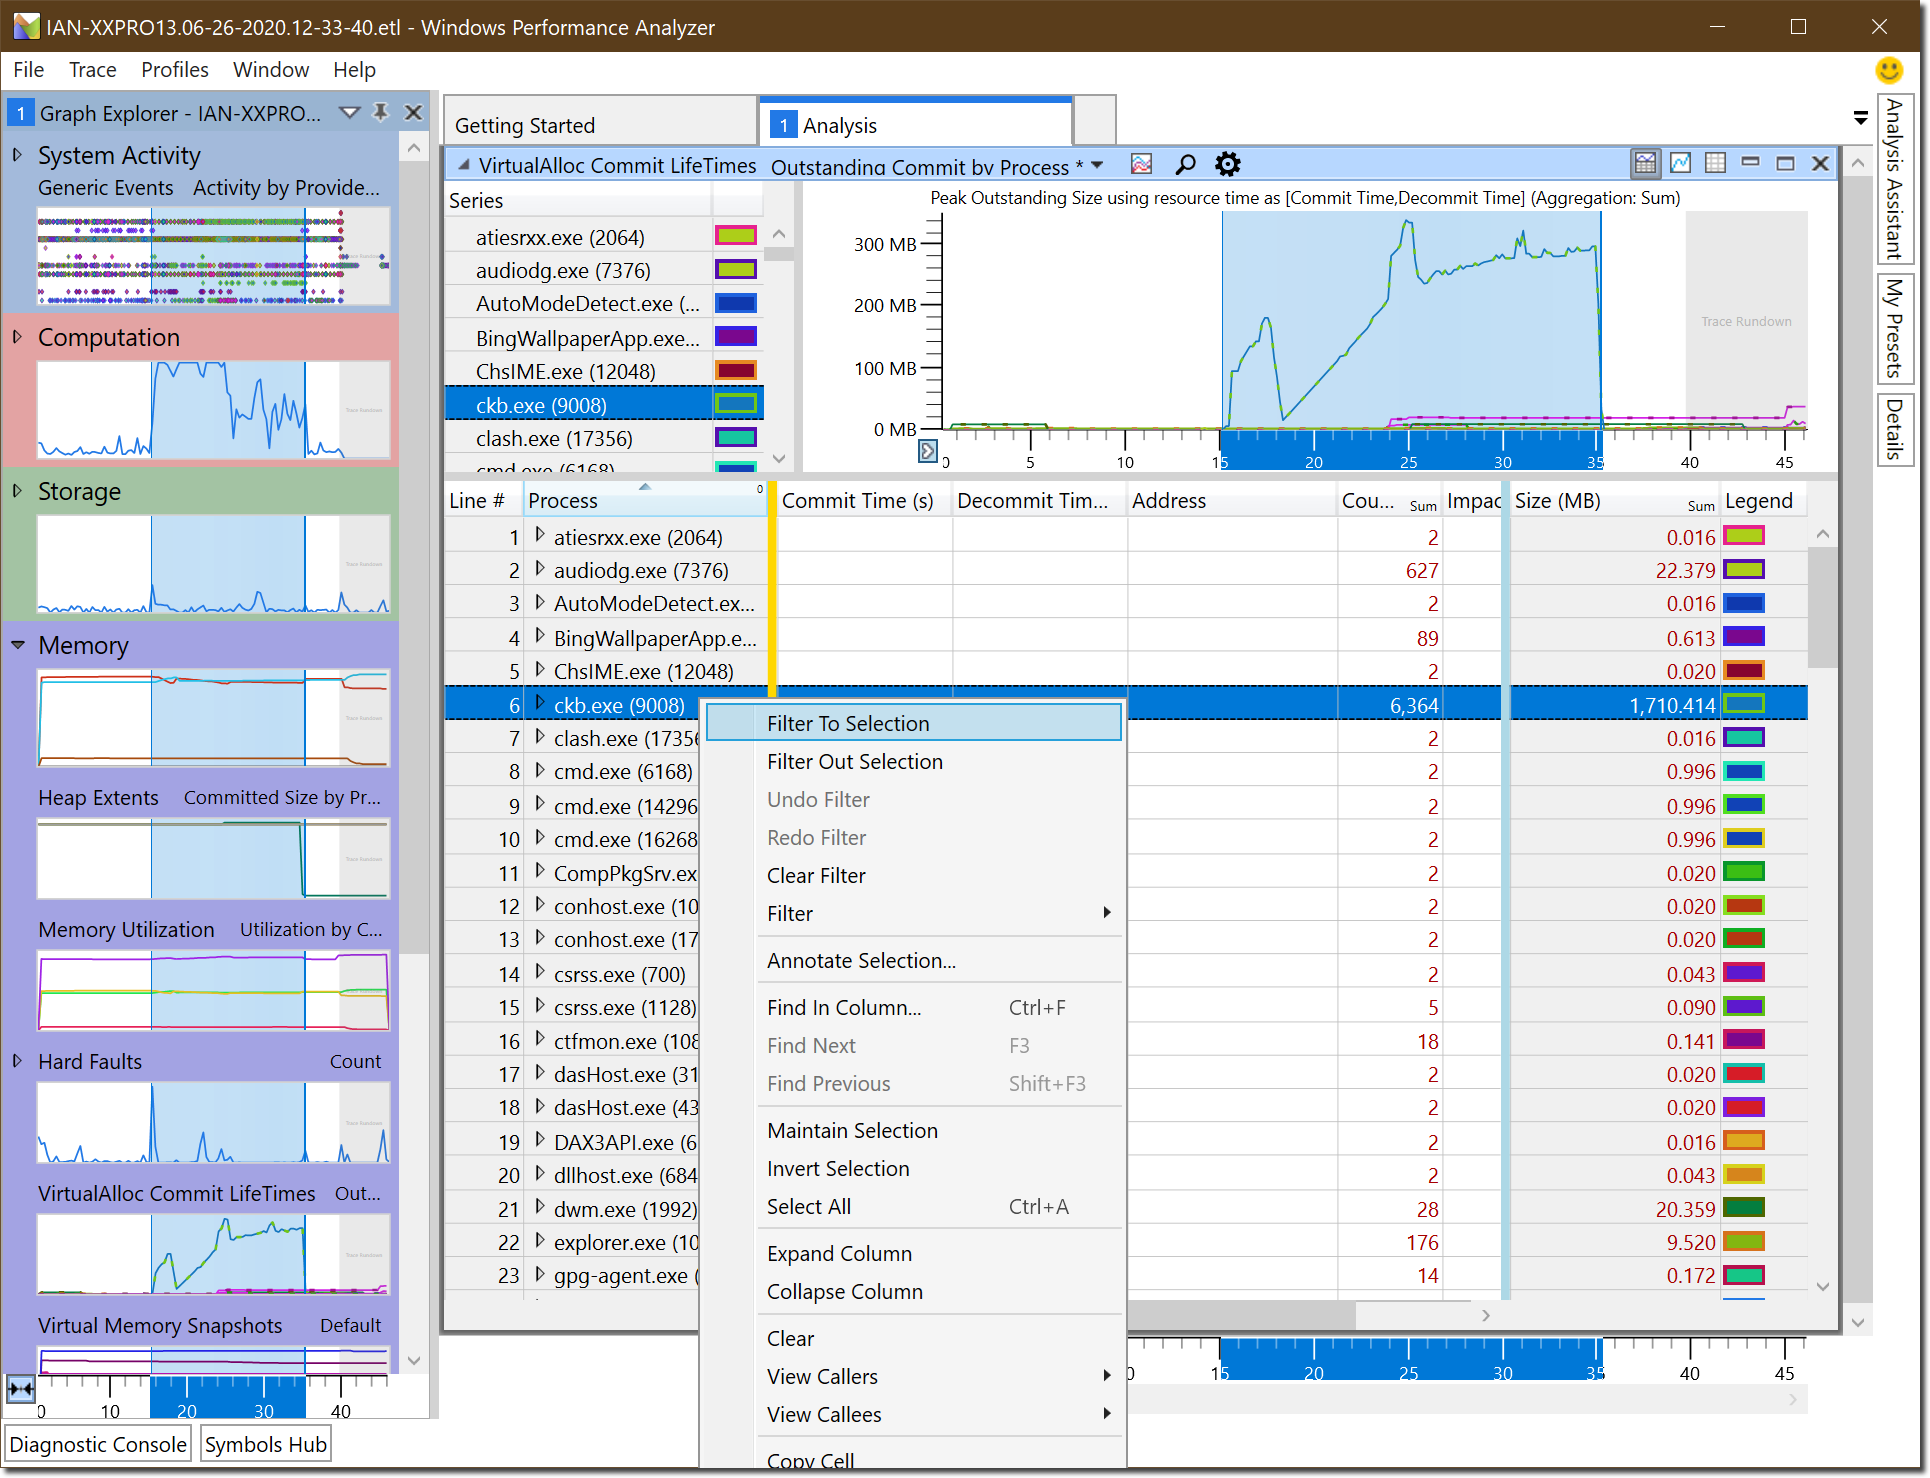
First filter the the result to only show the target process. Find the process in the table and apply “Filter to Selection” in the right click context menu.
The key columns of interest are the following (source):
| Column | Description |
|---|---|
| Process | The name of the process that performs memory allocations through VirtualAlloc. |
| Commit Stack | The call stack that shows the code path leading to memory being allocated. |
| Commit Time | The timestamp of when memory was allocated. |
| Decommit Time | The timestamp of when memory was freed. |
| Impacting Size | The size of outstanding allocations or the size difference between the start and end of the selected time interval. This size adjusts based on the selected view port.The Impacting Size value will be zero if all memory allocated by a process is freed by the end of the visualized interval in WPA. |
| Size | The cumulative sum of all allocation during the selected time interval. |
New columns can be added by right click the existing column header. The lines are automatically grouped by the columns that on the left of the yellow vertical bar.
However, I find out that it is hard to locate the leaf nodes when dragging the Commit Stack column to the left.
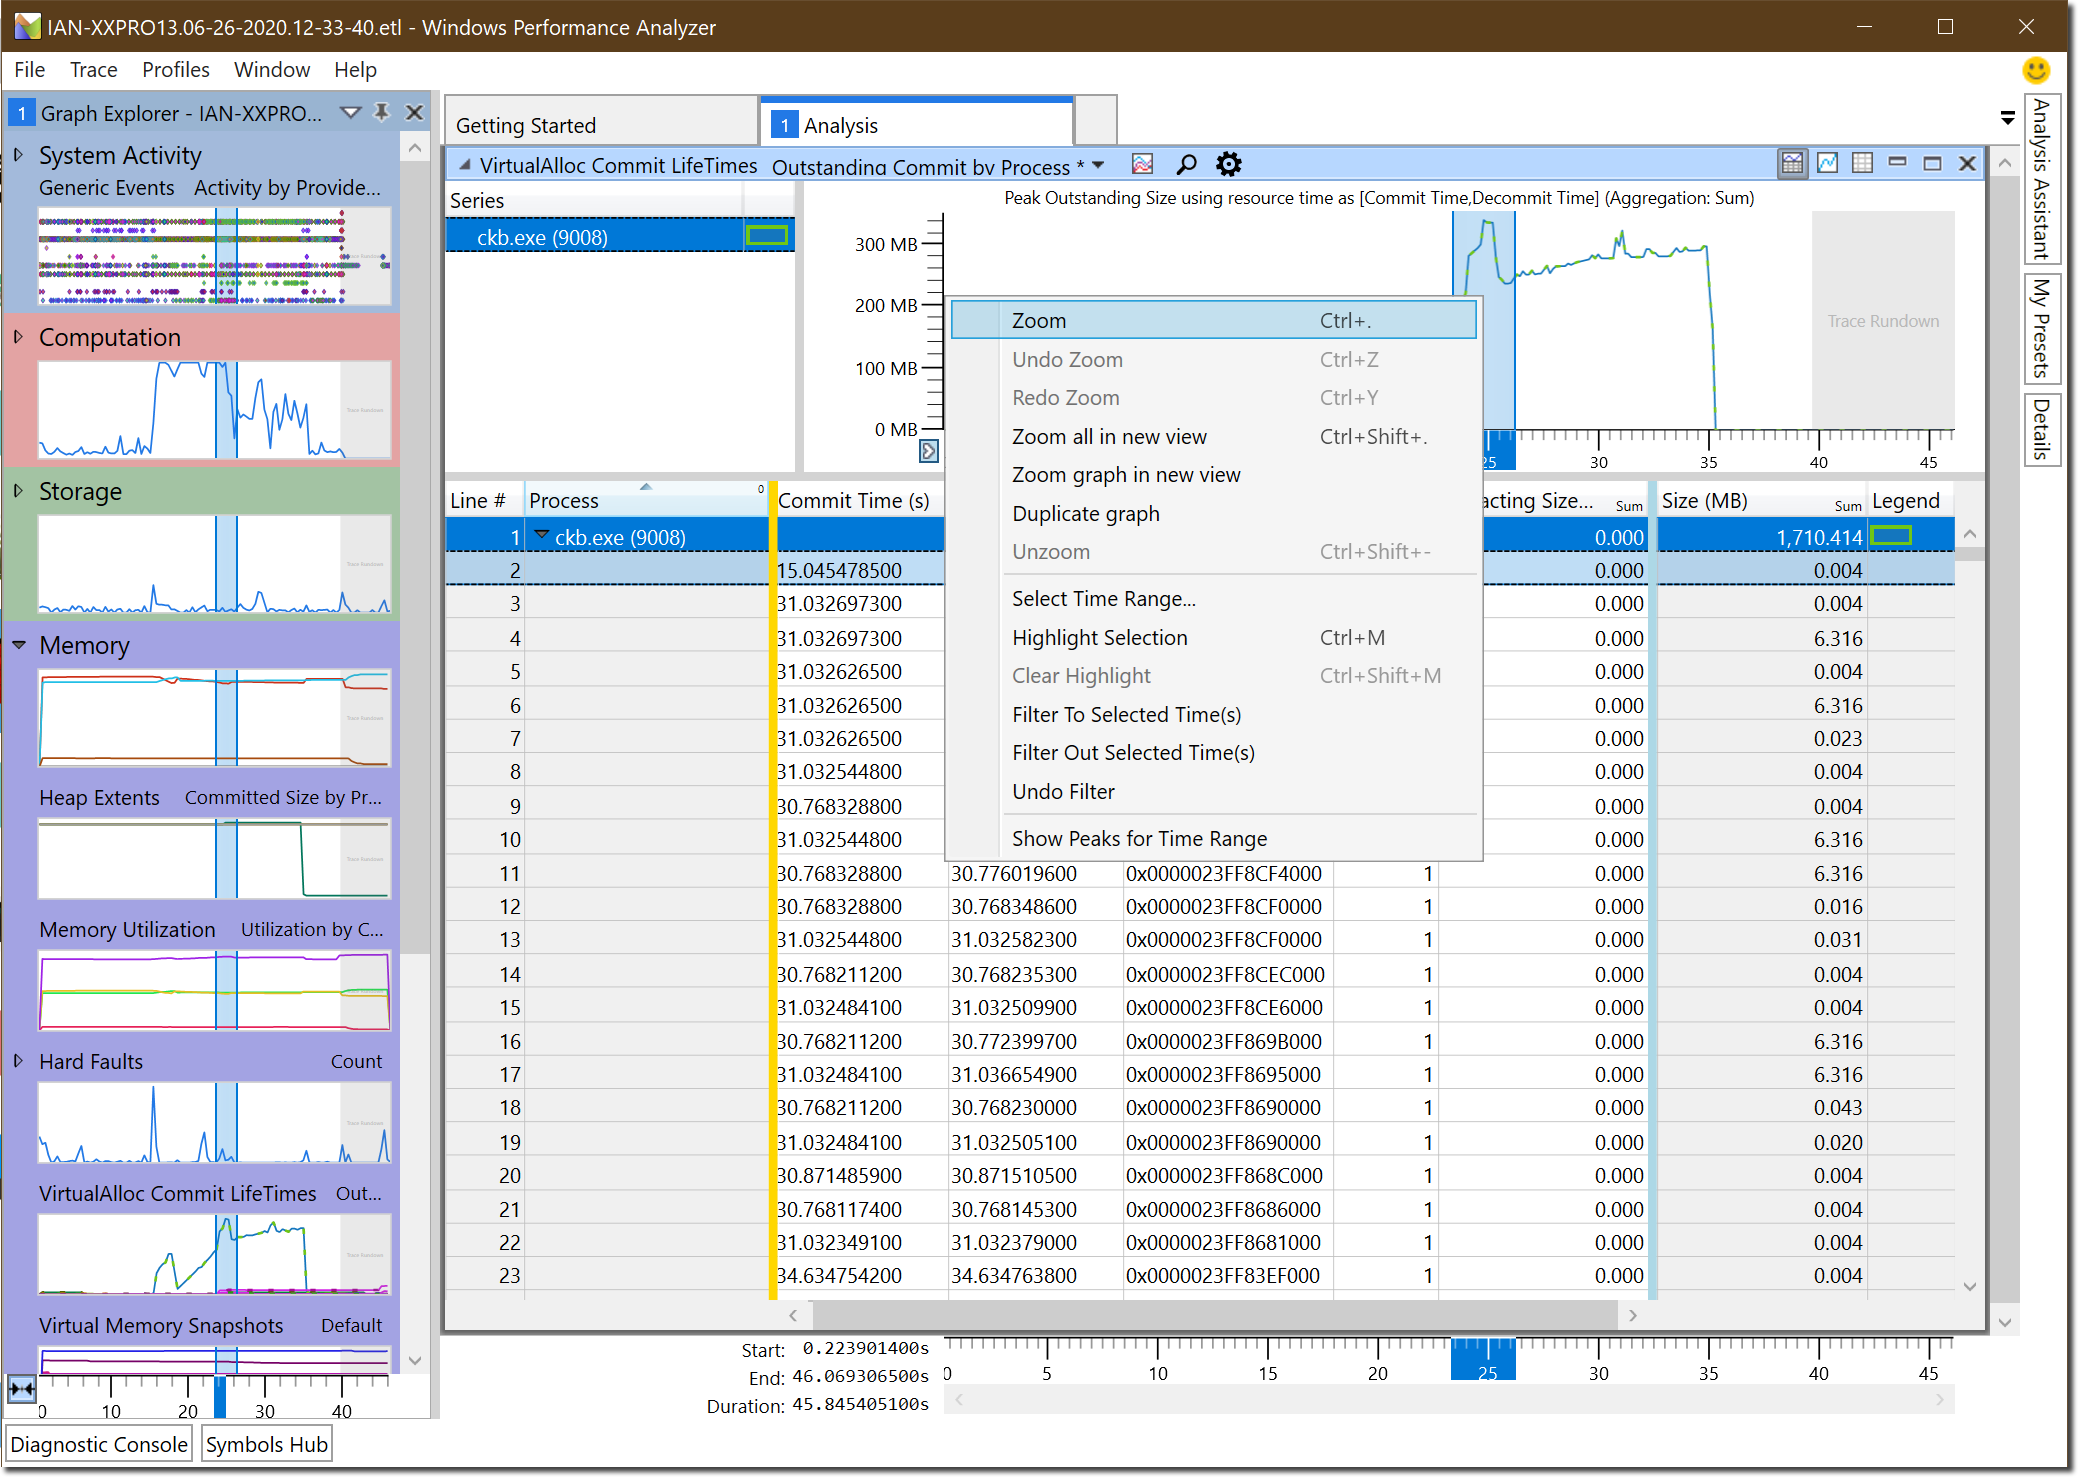
Sometimes, it is useful to zoom into a specfic time range, such as a memory surge to see the impacting allocations.
The Commit Stack does not loads debug symbols by default. First configure the symbols paths to include target process pdb file via menu item “Trace ➤ Configure Symbols Paths”.
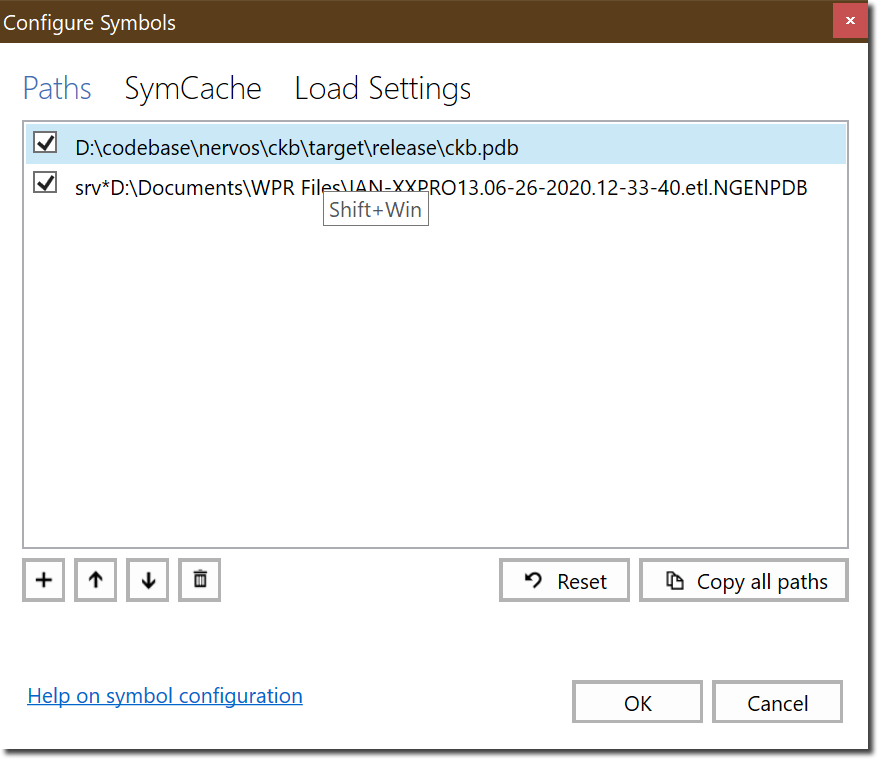
Windows Performance Recorder also automatically saves system libraries debug symbols in a “NGENPDB” directory. Windows Performance Analyzer will automatically add it. But if the recording file is too large, and the computer is not powerful enought, the computer may stuck at loading symbols. If so, uncheck the “NGENPDB” in the symbols paths.
After setting up the paths, select menu “Trace ➤ Load Symbols”.
Now Commit Stack will show the symbols.